Five tools that work as one system
Each capability connects to the others. Stock alerts trigger transfer requests. Forecasting informs reorder points. Dead-stock reports free capital for better-performing lines.
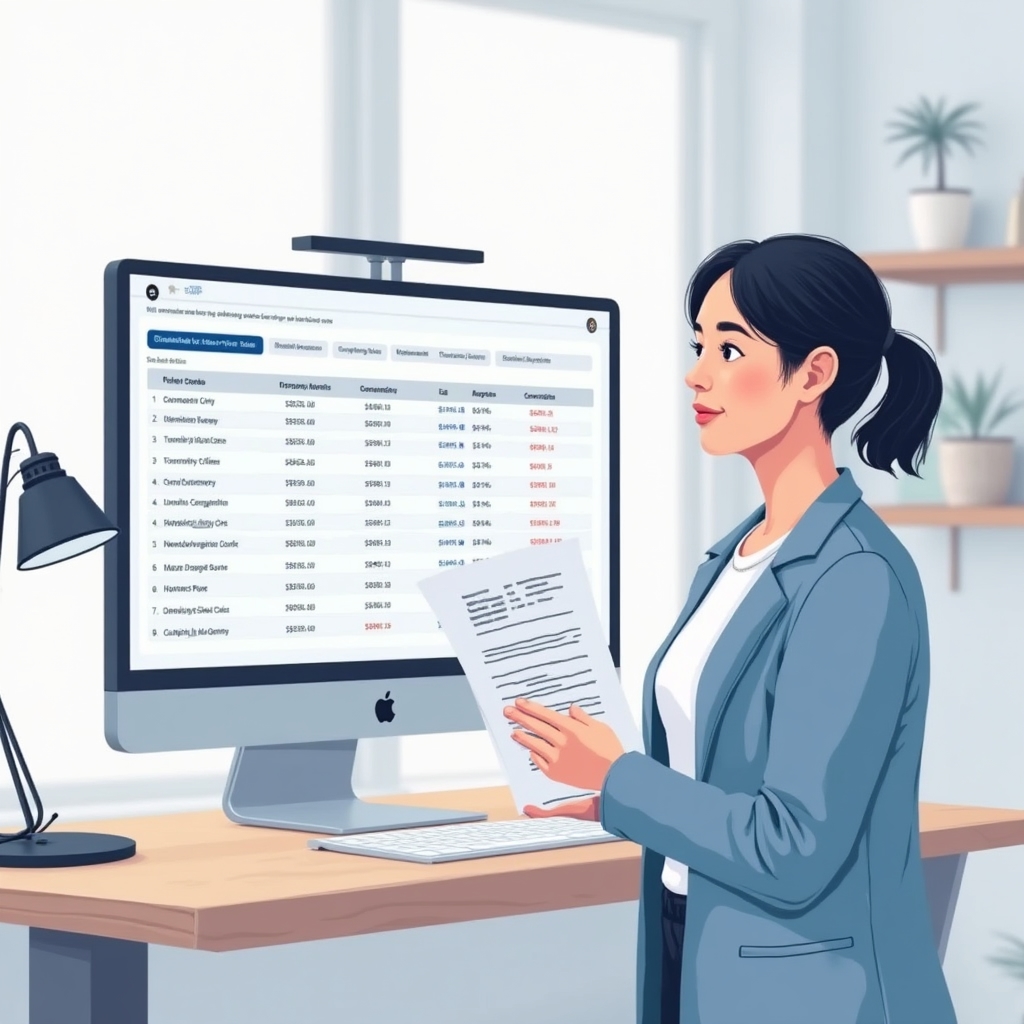
The dashboard pulls live inventory data from every connected store location and displays it in a single unified view. No more calling individual stores or waiting for end-of-day reports. When a sale happens at your downtown location, the count updates immediately across the platform.
Retailers with five stores see the same depth of information as those with fifty. The interface scales without becoming cluttered. Filter by location, product category, SKU, or supplier to focus on what matters in that moment.
- Location-by-location stock counts updated continuously
- Filter and search across all locations simultaneously
- Export snapshots for reporting at any point in time
- Drill into individual SKUs to see movement history
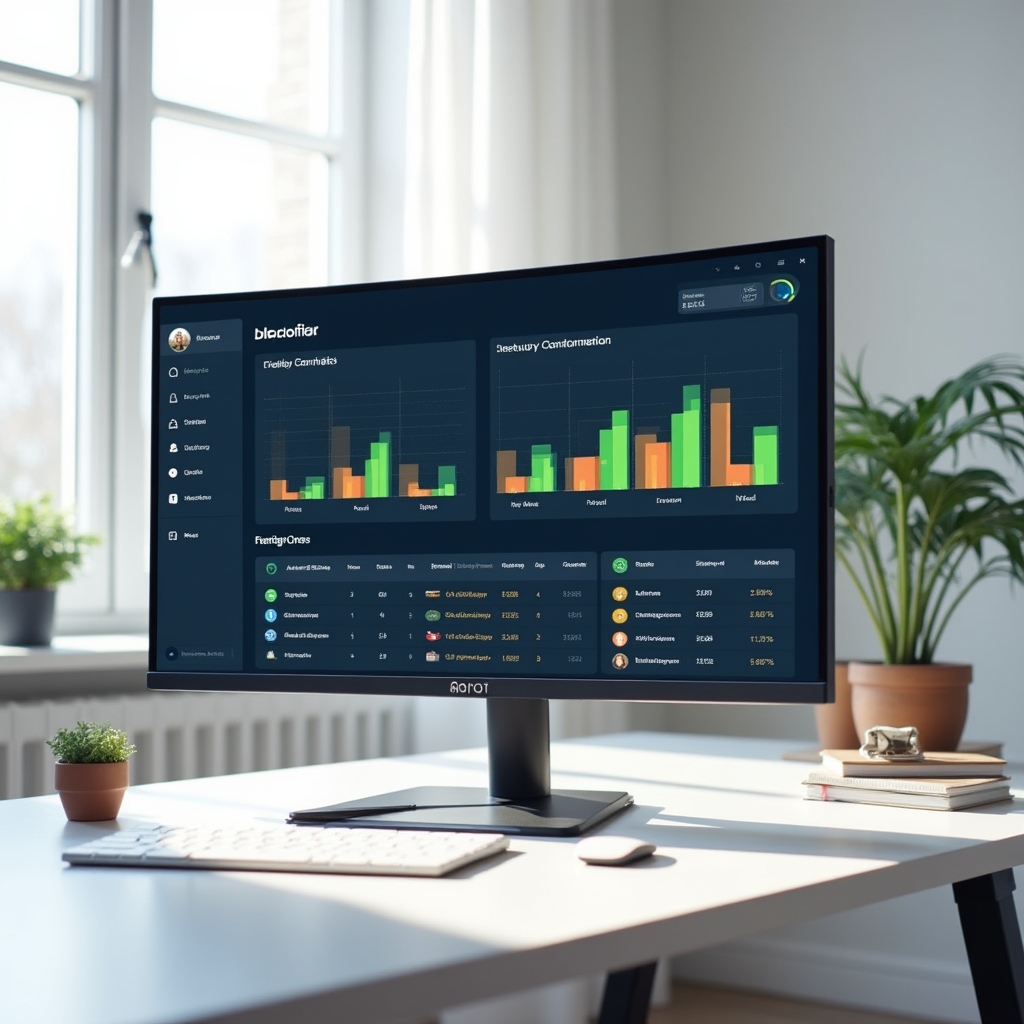
A downtown flagship store and a suburban outlet move inventory at different rates. The platform lets teams set reorder thresholds per SKU per location, so alerts fire at the right moment for each store rather than using a single blanket rule that fits none of them well.
Alerts reach the right people through email or in-app notifications. Set who receives alerts for which stores so district managers and store staff each get relevant information without noise.
- Per-location, per-SKU threshold configuration
- Role-based alert routing to relevant staff
- Alert history log for audit and review purposes
- Snooze and acknowledge workflow to reduce repeat noise
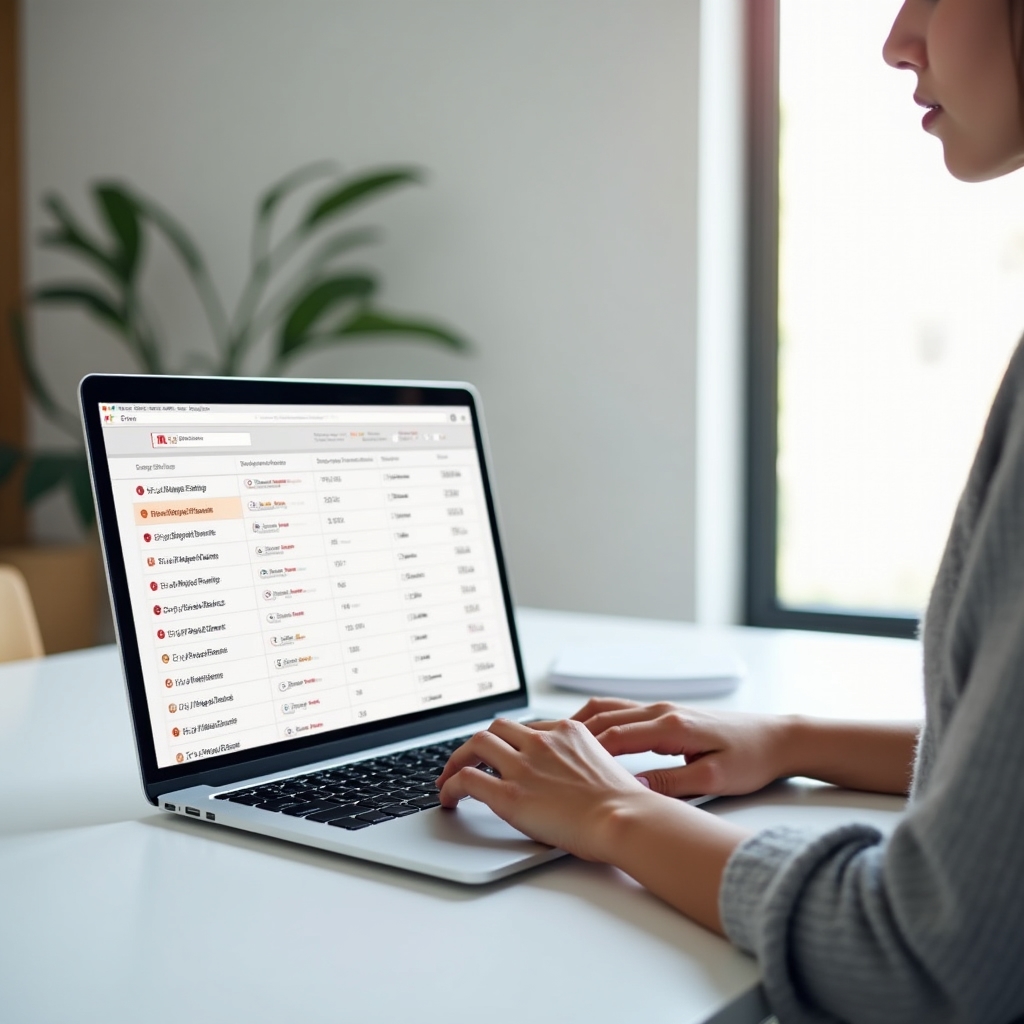
When one store is running low and another has surplus, the platform surfaces that opportunity automatically. Staff can initiate a transfer request directly from the dashboard. The request routes to the sending store for confirmation, then updates both locations' inventory counts when the transfer is marked complete.
Every transfer creates a paper trail. Managers can see pending, in-transit, and completed transfers at a glance. This removes the informal phone-call system that most multi-location retailers rely on and replaces it with a documented, trackable process.
- Initiate transfers from the same dashboard used for monitoring
- Approval workflow with sending-store confirmation
- Inventory counts adjust automatically on completion
- Full transfer history for reconciliation

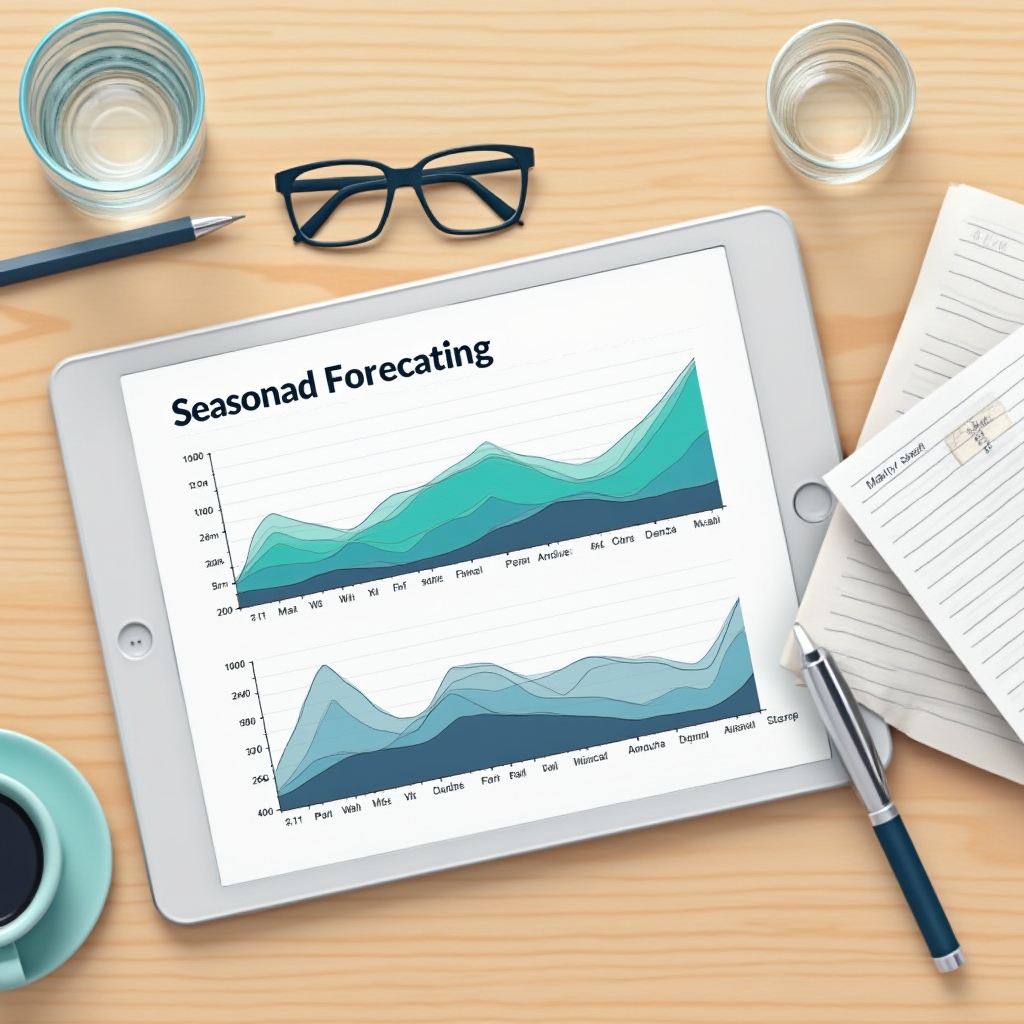
The forecasting module uses historical sales data from the same period in prior years to project demand for the weeks and months ahead. It works at the location level, so if your lakeside store sells more outdoor gear in summer while your city location stays steady year-round, the forecasts reflect that difference.
Forecasts inform suggested reorder quantities and timing. Teams can review projections, adjust for known factors the system cannot see (a planned promotion, a local event), and use the output to negotiate with suppliers earlier.
- Location-specific seasonal demand curves
- Adjustable projections for manual overrides
- Suggested reorder timing based on lead times
- Year-over-year comparison views
Dead stock is inventory that has not sold within a defined period. It occupies shelf space, ties up working capital, and often goes unnoticed until a physical count reveals the problem. The platform generates regular reports that flag slow-moving and stagnant SKUs by location before they reach that point.
Reports show how long each item has been sitting, its current quantity, and its carrying cost estimate. This gives buyers and merchandisers the information they need to decide whether to discount, consolidate to one location, return to supplier, or discontinue the line entirely.
- Configurable thresholds for what counts as dead stock
- Reports broken down by location and category
- Carrying cost estimates to quantify the problem
- Exportable for use in buyer review meetings